Global Inflation Tracker
↗ GitHubactive
Built on Databricks Community Edition, pulling CPI data from the FRED API for Brazil, Japan, UK, and USA. Bronze stores the raw API response. Silver removes duplicates and cuts each series to a shared date range so all four countries cover the same window. Gold maps FRED's series IDs to country names and builds the final table. The CSV here came straight out of that Gold layer.
PySparkDelta LakeFRED APIDatabricksPandas
pipeline
FRED API→Bronze→Silver→Gold→CSV export
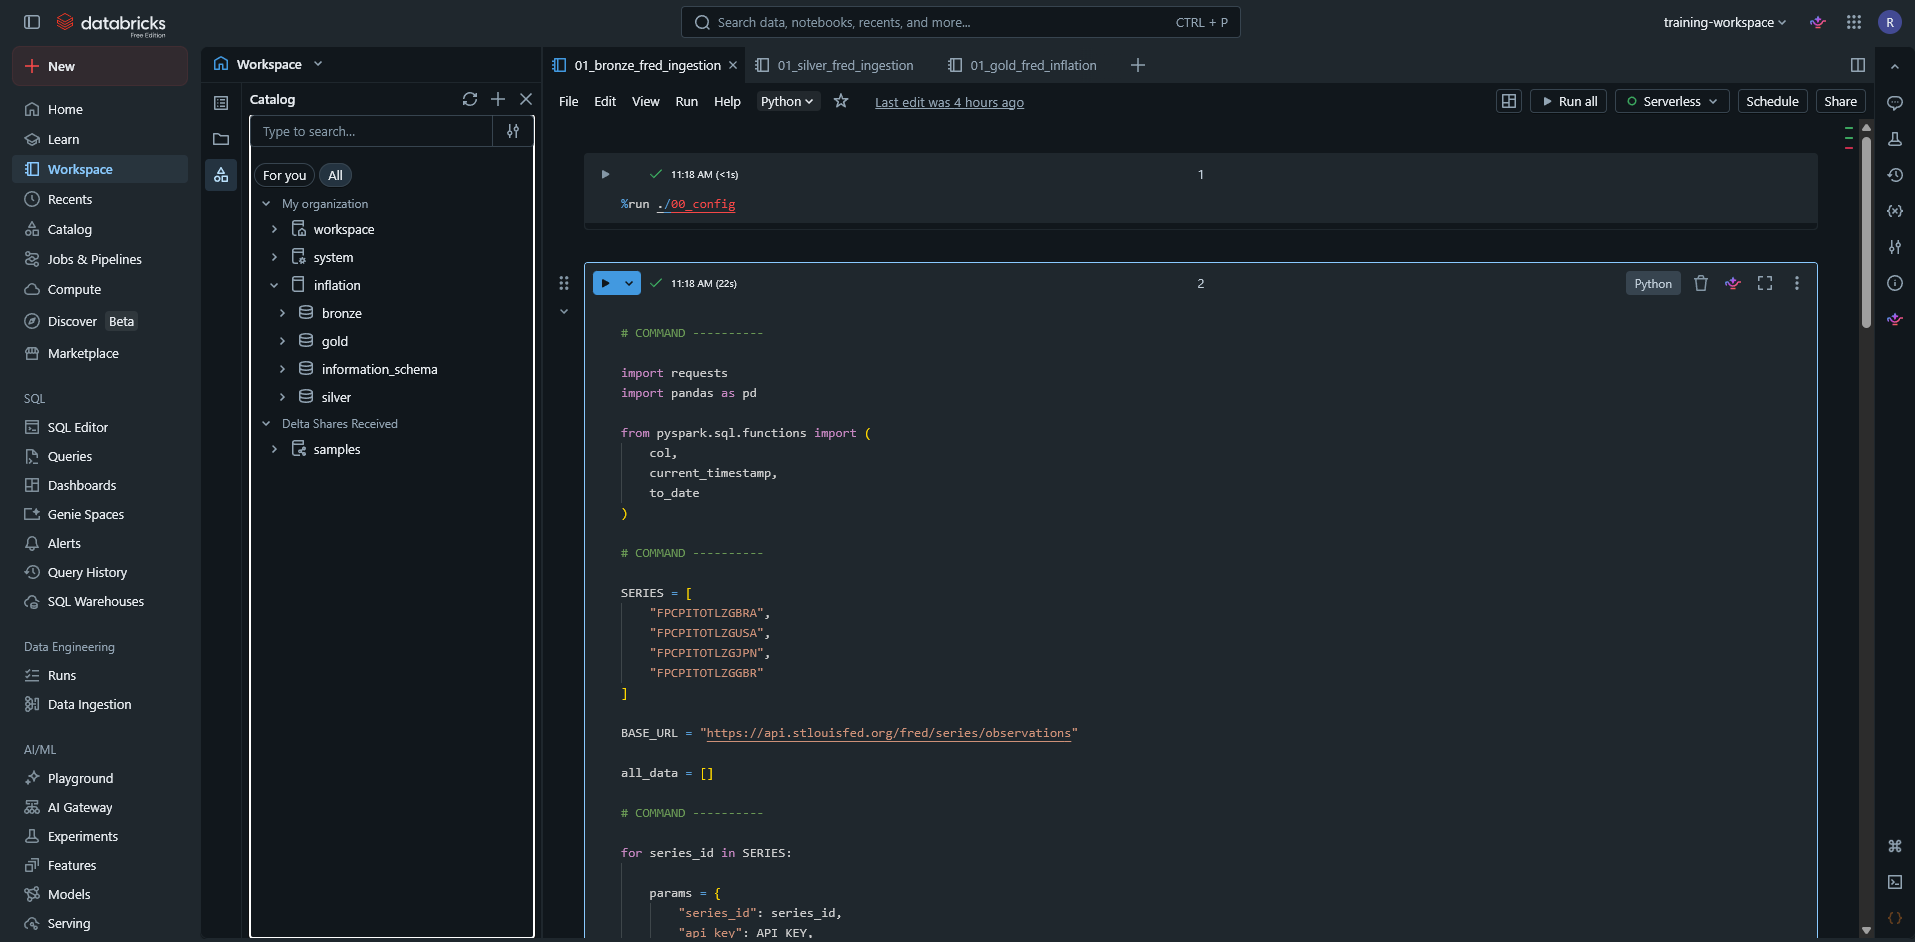
▶01 · Bronze — FRED API ingestioninflation.bronze.fred_global_inflation_raw
import requests
import pandas as pd

from pyspark.sql.functions import (
    col,
    current_timestamp,
    to_date
)

# COMMAND ----------

SERIES = [
    "FPCPITOTLZGBRA",  # Brazil
    "FPCPITOTLZGUSA",  # United States
    "FPCPITOTLZGJPN",  # Japan
    "FPCPITOTLZGGBR"   # United Kingdom
]

BASE_URL = "https://api.stlouisfed.org/fred/series/observations"

all_data = []

# COMMAND ----------

for series_id in SERIES:

    params = {
        "series_id": series_id,
        "api_key": API_KEY,
        "file_type": "json"
    }

    response = requests.get(BASE_URL, params=params, timeout=30)
    response.raise_for_status()

    observations = response.json().get("observations", [])

    for row in observations:
        all_data.append({
            "series_id": series_id,
            "date": row.get("date"),
            "value": row.get("value")
        })

# COMMAND ----------

pdf = pd.DataFrame(all_data)
spark_df = spark.createDataFrame(pdf)

# COMMAND ----------

bronze_df = (
    spark_df
    .filter(col("value") != ".")
    .withColumn("date", to_date(col("date")))
    .withColumn("value", col("value").cast("double"))
    .withColumn("ingestion_timestamp", current_timestamp())
)

# COMMAND ----------

bronze_df.write \
    .format("delta") \
    .mode("overwrite") \
    .option("overwriteSchema", "true") \
.saveAsTable("inflation.bronze.fred_global_inflation_raw")▶02 · Silver — dedup & date alignmentinflation.silver.fred_global_inflation_silver
from pyspark.sql.functions import (
    col,
    min as spark_min,
    max as spark_max,
    count,
    current_timestamp
)

# COMMAND ----------

BRONZE_TABLE = "inflation.bronze.fred_global_inflation_raw"
SILVER_TABLE = "inflation.silver.fred_global_inflation_silver"

spark.sql("CREATE SCHEMA IF NOT EXISTS inflation.silver")

bronze_df = spark.table(BRONZE_TABLE)

# COMMAND ----------

# Duplicate check
duplicate_check_df = (
    bronze_df
    .groupBy("series_id", "date")
    .agg(count("*").alias("duplicate_count"))
    .filter(col("duplicate_count") > 1)
)

dedup_df = bronze_df.dropDuplicates(["series_id", "date"])

# COMMAND ----------

# Align date ranges across all series
series_date_limits_df = (
    dedup_df
    .groupBy("series_id")
    .agg(
        spark_min("date").alias("series_min_date"),
        spark_max("date").alias("series_max_date"),
        count("*").alias("total_rows")
    )
)

global_date_limits = (
    series_date_limits_df
    .agg(
        spark_max("series_min_date").alias("global_min_date"),
        spark_min("series_max_date").alias("global_max_date")
    )
    .collect()[0]
)

global_min_date = global_date_limits["global_min_date"]
global_max_date = global_date_limits["global_max_date"]

# COMMAND ----------

silver_df = (
    dedup_df
    .filter(
        (col("date") >= global_min_date) &
        (col("date") <= global_max_date)
    )
    .withColumn("silver_processed_timestamp", current_timestamp())
)

# COMMAND ----------

silver_df.write \
    .format("delta") \
    .mode("overwrite") \
    .option("overwriteSchema", "true") \
.saveAsTable(SILVER_TABLE)▶03 · Gold — analytics layerinflation.gold.global_inflation_analytics
from pyspark.sql.functions import col, when, current_timestamp

# COMMAND ----------

SILVER_TABLE = "inflation.silver.fred_global_inflation_silver"
GOLD_TABLE   = "inflation.gold.global_inflation_analytics"

spark.sql("CREATE SCHEMA IF NOT EXISTS inflation.gold")

silver_df = spark.table(SILVER_TABLE)

# COMMAND ----------

# Map FRED series IDs to country names
gold_df = (
    silver_df
    .withColumn(
        "countries",
        when(col("series_id") == "FPCPITOTLZGBRA", "Brazil")
        .when(col("series_id") == "FPCPITOTLZGUSA", "United States")
        .when(col("series_id") == "FPCPITOTLZGJPN", "Japan")
        .when(col("series_id") == "FPCPITOTLZGGBR", "United Kingdom")
        .otherwise("Unknown")
    )
    .withColumnRenamed("value", "inflation")
    .drop("series_id")
)

# COMMAND ----------

gold_df = (
    gold_df
    .select(
        "countries",
        "date",
        "inflation",
        "ingestion_timestamp",
        "silver_processed_timestamp"
    )
    .orderBy("countries", "date")
)

# COMMAND ----------

gold_df.write \
    .format("delta") \
    .mode("overwrite") \
    .option("overwriteSchema", "true") \
    .saveAsTable(GOLD_TABLE)
architecture
FRED APIexternal source
Federal Reserve Economic Data — annual CPI series for Brazil, Japan, UK, and USA. Series IDs: FPCPITOTLZGBRA, FPCPITOTLZGUSA, FPCPITOTLZGJPN, FPCPITOTLZGGBR.
↓
Bronze Layerraw ingestion
Pulls raw API responses, casts dates and numeric values, stamps ingestion_timestamp. No business logic — source fidelity preserved.
↓
Silver Layerdeduplication & harmonization
Removes duplicate records. Aligns all four series to the global shared temporal window (max of series start dates, min of series end dates), then stamps silver_processed_timestamp.
↓
Gold Layersemantic · analytics-ready
Maps FRED series IDs to readable country names, renames value to inflation, reorders columns. Business-ready dataset ready for direct consumption.
↓
Streamlit Analyticsinteractive visualization
Reads the Gold CSV export. Country filters, year range slider, log/linear scale toggle, rich hover tooltips with year-over-year delta and peak indicators, and an interactive Plotly chart.
engineering decisions
Bronze preserves raw source fidelity
The Bronze layer writes exactly what the FRED API returns — no transformations, no renaming. If anything breaks downstream, the raw payload is always there to re-derive from.
Silver harmonizes temporal windows across all series
Different FRED series start and end on different dates. Silver computes the global min/max dates shared by all four and trims each series to that window — no country gets a time-range advantage when comparing trends.
Gold applies semantic business-layer naming
FRED series IDs (FPCPITOTLZGBRA) are machine codes. Gold maps them to country names so the analytical layer speaks the language of the domain, not the API. The column is also renamed from value to inflation.
Delta Lake ensures transactional consistency
Each layer writes as a Delta table with overwriteSchema enabled. ACID transactions mean failed pipeline runs leave the catalog in its previous state — either the write commits fully or it doesn't.
Medallion Architecture enables independent layer rebuilds
Bronze/Silver/Gold is a deliberate separation of concerns: ingest raw, clean and harmonize, serve analytics-ready. Each layer has a single responsibility and can be rebuilt without affecting the others.
about the dataset
Source
FRED Economic Data (Federal Reserve)
Countries
Brazil · Japan · United Kingdom · United States
Historical range
1981 – 2024
Observations
176 rows · 44 per country
Update frequency
Annual · manual pipeline re-run
Storage format
Delta Lake (Databricks Community Edition)
Architecture
Medallion — Bronze / Silver / Gold
live analysis